Monday, October 28, 2013

I just bought me some coffee


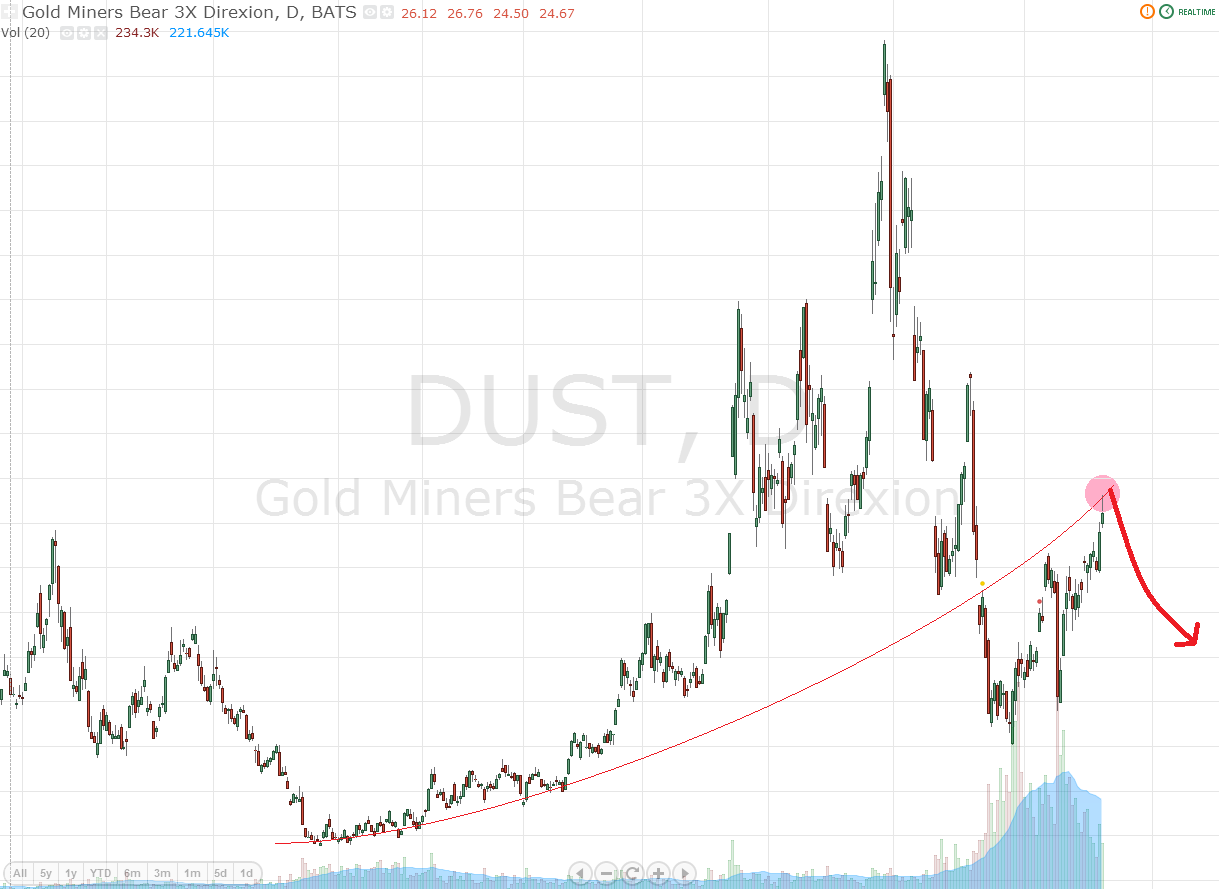
Coffee traded through the ETF JO looks ready to turn. Here is the chart seen through my 3X inverted stock chart tool:


That is one wacky chart. It's up 20 X since the bottom, or 2000%. If this was a 3X inverse ETF I would be drewling right now. But it is a straight non leveraged ETF which is not that bad either. I will add to this position on any further declines.


Thursday, October 24, 2013

A blow of top to be remembered

I trade two slighly different but similar patterns, blow off top patterns and megaphone patterns. While the trades based on megaphone patterns have performed well the same can not be said for all trades based on BOT patterns. I've lost moeny on two of them. One of them, TYL, has just kept on going and going.


But unless the whole theory of BOTs is wrong, and I've studied a lot of them, this is now a sure short sell. Hopefully we can get an overshoot today to get a good entry.

Another thougth is if this chart is telling something about the whole market. There are no longer any megaphone patterns on inverse ETFs, there are some candidates on long ETFs. So all visible patterns are for shorting the market.

Monday, October 21, 2013

Nasdaq looks overbought

Altough I like to be purely technical and I do not see a clear signal on the Nasdaq index it does look expensive here. Eric Parnell, one of the few analysts I follow, lists how many asset types has started to deviate from the QE pump trend. But more importantly, the chart looks a bit toppy. That's why I do a small short sale from here:


Erics article:

http://seekingalpha.com/article/1749832-stocks-and-qe-all-things-must-pass

Thursday, October 17, 2013

The Real Estate Bull facing resistance

I have a hard time fitting this trendline curve but it looks like DRN is pushing up towards the trendline for a second time.


But exactly at what point is hard to tell. I'll monitor this closely for a short entry above this level.

The leader of the Biotech bubble

I've written about Gilead Sciences (GILD) before. It's one of the stocks I'm both short and in the red. It's one of the three biggest Biotech companies in the world and of them it has the most bubbly chart. It reminds me of one of the leaders of the Dot Com bubble: Microsoft.


Before the top it started to get very jagged. It hade a large number of tops and overshoots (when the chart goes back down and then shoots up over the last top). This is what happened next:


If GILD follows Microsoft it would mean one more big overshoot up and then a big rollercoaster fall down.

Wednesday, October 16, 2013

Convex megaphone pattern trendline

Does the slope of megaphone patterns matter? I usually trade megaphone patterns with a concave trendline. Here's a convex one. TMW is pushing against the trendline resistance. If this pattern is predictable it is even better than the concave trendline pattern because the convex trendline is a lower trending trendline as opposed to the higher trending concave trendline.


Friday, October 11, 2013

DUST update


It's not always clear where to draw the trendline. Here is the old trendline adjusted slightly upwards. If DUST follows this line then a turn could happen around the 50 level. Patience is needed here before adding to the short position or to NUGT.


Wednesday, October 9, 2013

DUST Update


As I suspected DUST touched the trendline. It is now in the zone for a turn. I'm entering a short sell here. If it moves further up I will add to the short sale and or add position in the opposite ETF: NUGT.

Here was my thought on DUST from September 23, pretty close to what has happened since:

Wednesday, October 2, 2013

Performance September 2.7%

Portfolio performance after all fees paid was 2.7% in september. I am now overweight short positions in the portfolio and most of them have negative return so far. The short positions are in blow off tops and the patterns look solid but when they will break is hard to tell.