Saturday, August 31, 2013

Performance August 8.40%


Total portfolio performance, realized and unrealized after all fees paid, for August was 8.40%. Totally ok for a month. If I can repeat it next month I'll be happy. Best performers where short positions in DUST and DSLV. Worst performers where short position in EDZ and long position in IDXJ.

Thursday, August 29, 2013

Plans for DUST

DUST is climbing again, which I was hoping for sinse I want to short it before it goes back down. The recent experiance with India and Indonesia ETFs has made me think about a plan for how I will accumulate short positions in DUST.

First I start with my expectations of how DUST will move. It could go lower at anytime from here but if it continues to climb I don't think it will go much higher than 40. (See previous posts on megaphone patterns and DUST for further analysis) Although I would want to get in right away to not miss out on any down move, a lot of money is made by getting the first entry late.

Heres my accumulation plan:

Price level, Allocation of portfolio

around 28-29, 6%
33, 6%
36, 12%
39, 12 %
44, 12%
50, 6%

I may adjust these as I go, especially the entry level, sinse I'm not a strict believer in trading according to predefined rules. If it reaches 40, and that's a big if I would be 36% of portfolio commited. Any rise after this I could still handle but I don't plan for accumulating as fast after 44 as that is not my expected scenario according to how I've read the chart.


-----

Edit: As soon as I published this I got my first entry at 29. I'm very relieved to be in the trade sinse I am a big believer in it.


India in reverse


And India is in full blown reverse mode today. I havn't checked Indonesia but can only guess. The predictability of the megaphone pattern is strong. It's a high likelyhood that the bottom is in but not garanteed. Further spikes can come and then I will allocate more money to this trade. I'm currently only about 24% of portfolio commited. It is hard to know at what point the BOT exactly is turning, and I want to keep adding money to the trade on the way so that a big portion of the money in the trade is near the turning point. Unfurtunaltely I didn't feel I did that good enough on this trade. More money could have been placed near the turning point. This is the only big trade I'm involved in at the moment so I could have allocated more than 24% at this point. I have the opportunity to go to leverage if needed so even 100% portfolio allocation would have been ok, especially considering I used only non leveraged ETFs for this trade. I have to start out smaller and increase the size of the bet for each day the trade is building. No day should have betting that is smaller than the day before if the BOT is continuing to build. I should evaluate probabilities of high high the BOT can go to see how many days I could at maximum endure before all my capital is used. The big misstake was probably yesterday when I could really smell a turning point but still didn't bet aggressivly but just added marginally to the existing position. This will be a profitable trade but the point is to maximize profit/risk taking in each trade.

Agriculture ETF: UAG

I don't know much about the agriculture business, except that if we don't go back to a hunter gatherer society it's here to stay. So is it in a reverse or straight BOT or megaphone pattern? Sinse these are the only patterns I'm looking for (the megaphone pattern being a type of BOT, blow off top, in my view) it better be if I'm going to trade it.

So let's see, here the chart of the agriculture ETF UAG straight:


It's been sloping lately, lets magnify the last part and reverse it like it was a 3X daily Bear ETF.


It's a pretty good climb, more than doubling the value. I see two main alternatives for this chart.
1. It touched the trendline from below a second time, it should therefor go down from here. (that means up in the real non inveresed ETF).

2. It can, while still respecting the broken trendline, start to do bigger megaphone patterns and thus still go up from here in the reverse chart (down for real). It has not been very megaphone-like yet. It's been more of a steady climb.

All in all this is worth monitoring, might even take a small position but probably not yet.


Wednesday, August 28, 2013

India

India ETFs are now in full blown megaphone pattern mode. This usualy only ends one way.

INP (3X Inverse)

I am now about 21% of total portfolio commited in India and Indonesia ETFs. From that position the loss is about 7-8% percent so far. I will continue to add on further declines.


Monday, August 26, 2013

Bounce wish list

To specify what I'm actually waiting for, if nothing interesting happens elsewhere, is a bounce in the following: DUST and DRV. Since I'm hoping this is going to happen I'm going to sell off other positions in preparation. Since I'm already invested in India ETFs, although not to a large degree, I won't benefit as much from any further spiking there. Also the India ETF is played through a non leveraged ETF on the long side, while DUST and DRV can more profitably be traded by shorting 3X leveraged ETFs.

Sunday, August 25, 2013

Waiting for Monday


I really don't have any clear ideas for Monday. Nothing shows up on the scanners the way things showed up last week. Instead I'm going to do something I plan to do more often. Wait for good opportunities to come to me. If the market is about to go down then long term BOT patterns are going to show up for individual stocks. There are some megaphoning patterns on ETFs but they have already spiked short term. Until they spike again or BOTs appear I'm going to monitor my positions and raise some cash until the next good opportunity, they always come along.

Saturday, August 24, 2013

DRV - Was that all?

DRV
I sold of my position in DRV from the top with a very small profit. The reasoning is that the second top is not much to look at compared to the first. It should be even bigger, it is the second one and there is a clear tendency for reversed leveraged charts like this to go through periods of volatility in a megaphoning pattern. So I am hoping for at least a small overshoot of the last top to get a chance to get back in near the 80 level. (It must have reverse splitted since Friday? I rememer it being in the 23:s) But there is also a risk that this is all we get. The second top has an exponential unsustainable shape while the first one has a typical consolidating strenthening shape.

Another tool for stats of charts

I completed another tool or page rather to view stats for climbs and slopes of charts. It's all accessible via the links to the right. I'll probably won't do anymore tooling for some time since it is a lot of work and I got most of the things I wanted. This new page will show the percentage gain or loss of a current climb or slope and list previous periods. I'm not sure about the value of it all yet but there's nothing similar out there as far as I know. Most technical traders are not as fixated in only bottoms and tops as I am. I also included links to yahoo charts for every climb or slope, maybe I will get so used to looking at them that even clearer patterns starts to appear.

I'm happy with how things are going on the markets in general but as far as the bog is conserned I don't think I have more than one or at most two readers that are not robots, no one has ever commented anything. But I have made very good recommendations so far on this blog and since the start if it my account is up substantially (in a short time) so you don't know what you are missing. :)  I've read a lot of finance and trading blogs and although the quality of writing and market knowledge probably surpasses mine by far on most of them not many give clear recommendations on what to buy or sell and is right as often as I've been. And in trading that's what counts.

Thursday, August 22, 2013

India close to a short term bottom

INP (3X reversed) in megaphone pattern

News from India is very bearish. Volume in most India ETFs spiked two days ago. Yesterday was a 5% down day. (15% up on the 3X reverse chart) A reversal day is close. However it still might be early in the general megaphone pattern with more tops to follow. The correction might be short lived and a bigger spike might start to form. Another possibility is that this might turn in to an even bigger spike right away. That would be a gift and should be betted aggressively. Anything up from here should be betted but with some caution that this is most like not the end of the pattern. The risk in situations like these is that the pattern will not go below this point for months from here. I studied a lot of megaphone patterns and I would say that this pattern is beond that point now. People who played the second largest top from here might have their money trapped for some time but people who play this top most likely wont.

Sunday, August 18, 2013

The most interesting individual stocks for Monday

All charts here are 3X daily inverted. All of these look more or less ready for a trade.

OGXI
ICF
CCG
KRC


Saturday, August 17, 2013

Ideas for Monday


Real estate ETF looking almost ready. I'm hoping for an overshoot (when the stocks breaks the exponential curve but still moves higher, usually in the end of a BOT) to enter. Unfortunately there are no stocks available for short sale at my broker. Alternatives are SRS or going long an unleveraged ETF, there are plenty to choose from. In those cases I pick the one with the highest volume. Volume has value. JP Koning in his excellent blog on monetary matters calls this liquidity premium.


This is REZ, a regular real estate ETF, with the chart altered 3X and inverted. It is looking totally ready.


Brazil bear ETF BZQ is not quite ready to be traded yet (A general rule of stock trading I believe in is that it is better to miss opportunities than to do mistakes) but looks very interesting. I wonder where it is going with this. 


This is an India ETF. I don't think there is any 3X bear India ETF available. Taking a regular ETF and inverting it and expanding it 3X shows a better picture of what's going on. The chart is clearly spiking inside a megaphone pattern. My favourite pattern to trade. That the latest gap down is so big shows there is a lot of momentum in the movement. If the spike is not bigger on Monday then it means it spiked when the market was not in session. This is close to a trade, Monday will tell.

I'll plan to do a post (no promises) with regular stocks in inverse BOT/Megaphone patterns before Monday but ETFs are my first priority.

After the megaphone pattern

I exited DUST (short position) on Friday. The move down have been fast. But not only that, it's been exponential and that is something I always look for in my trading decisions wheater it be buying or selling.

Edit: Another reason I forgot to mention was tht it had a large volume spike yesterday. Usually a spike in volume comes a day or two before a reversal, sometimes at the same day.


When a chart breaks down from a megaphone pattern like this, with increasing tops, concave support floor and a break of resistance their is still money to be made on the short side in the coming months. I'm expecting DUST to loose half its value from here within a few months. Until then I'm hoping for a bounce and to reenter on the bounce. I highly doubt that this chart could crawl back up to previous tops. It might make an attempt at the 80 level since that is where the last concave support line is, but it is doubtful if it will get that far. Available stocks for short selling is another question. If the bounce is sharp enough I could as an alternative to shorting DUST go long a regular gold miner ETF (GDX) or even the leveraged bull ETF (NUGT). 


Friday, August 16, 2013

Version 2 of the scanners

This is going to be a short post because I'm exhausted from buidling version 2 of the new tool. But the result is visible on the first links to the right on this site. There are now five different scanners to choose from.

Markets are looking busy lately. The last longs I bought was BMR and HPS on reverse BOT pattern.

There are opportuities in the ETFs coming this way. Real Estate, India and utilities are buidling BOTs in their inverse charts.

Thursday, August 15, 2013

Finished!


I built the new tool. Well first version at least. Now available from this site are three new scan list of the following:

1. Leveraged ETFs scans on best 4 day performance (as a way to find a indicator of shorting opportunity).

2. Non leveraged ETFs scan on worst 4 day performance (indicator of long opportunity)

3. Stocks scan on boolinger band crash (indicator of long opportunity)

The reason I scanned for 4 day performance on ETFs is that that is a good enough criteria to search for short term BOT behaviour. BOT often come on really short term in ETFs.

The same with stocks but instead of doing my own scan algorithm I took onee from stockcharts.com. Bollinger band crash is a good enough criteria for short term volatility.

For now there is no scan for longer term BOT pattern. There is still the link to Alltimehighstocks available. I'll probably add my own scan in the future but this is good enough for now.

Monday, August 12, 2013

Plans for a new tool


It's a great day on the stock market again. I'm planning to continue work on the stock chart tool I've done and link it from this blog. The plan is to expand it and build a screener based on the BOT pattern in a couple of different categories and then display chart images for the top results. Displaying chart images for regular charts is pretty straight forward with Yahoo or Finviz charts. But I would also like to display images for data I have modified and for this I would have to hook up some other tool. Google seem to have a javascript charting tool that might fit. Preferable all charts would come from the same supplier.

This tool would look for long term BOTS but most of all medium term megaphone volatility patterns (A type of BOT pattern). I'm really excited about that pattern, how often it can be found and how reliable it seems to be. When visible in ETFs it is also garanteed that bankruptsy cannot happen since there is no underlaying business tracked, only sectors, regions, bonds or commodities and they cannot become worthless. Well bonds maybe but rarely.

----

BTW, todays activity so far is Short BOFI, Long ANV and BCE. I have previously displayed charts for these stocks.

Saturday, August 10, 2013

BOT in BOFI

I was so busy playing with the "invert and magnify" stock chart tool I built that I didn't scan for any BOT patterns on Friday. Well here is one:

Am I not a pretty chart?
It doesn't show clearly but the price stands at 67. Depending on the price action on Monday this will be a bet (short) from this level and above.

----

BTW, if anyone is reading this and notices misspelled words and other things of questionable quality, it's because I write this blog mainly for myself and therefor I'm not putting a big effort into the details. I'm not even sure a single real person has read a single post. I get som stats from Blogger but how do they kow it's human traffic? If your reading this and your human please write something in the comments, it could be complete nonsense. Just so I know if anyone is reading, I'm really curious!

Some more charts from the tool

TCL
MDC

GORO


Trying out the new tool

I'm taking the new tool out for a spin again (The one that inverts and magnifies daily movements for a chart similar to how inverse 3X daily ETFs do) . I'm screening for stocks in a downtrend and then I put them in the tool. This is some of the charts that comes out

AGU
A megaphoning chunk of volatility with a concave support floor just like is so regularly seen in volatile periods of levered inverse ETFs.

BCE
When I saw the above chart of BCE I thought, haven't I already seen this chart on the leveraged silver ETF?

DSLV
Yes I have! There it is.
ANV

And how about ANV for BOTyness and megaphone pattern? It might already have adjusted a lot when markets open on monday but the chart is extreme right now. I would short this aggressively if it was a leveraged ETF. The propblem with single stocks is that they can go bankrupt,but the question is, do they do it in this pattern? (Remember all these charts are upside down with 3X daily leverage).


TITN
And a final chart. Nothing extreme but still interesting.


Friday, August 9, 2013

A new tool for BOT purposes

Today I did something really nice, I built a tool that imports raw data from yahoo and then transforms it into an inverted leveraged dataset (depending on setting) and finally exports it into a csv file. The purpose is to be able to see chart action similar to that of inverse leverged ETFs but for regular stocks. The csv file can be imported in another tool that can chart it. Right now I'm using Excel (that took  a @!!!##!"!!!$! long time to set up right). Anyway here is an example:


No great opportunites visible here.


But sen from this perspective, inverted and with 3X daily leverage this chart looks like fun! Plenty of tradable peaks and a resistance line that gets clearly broken. The charts are not properly aligned but the benefit of this tool to see clearer what going on is showing. Another benefit is that trading by this tool would mean going long stocks. BOT trading is generally done by shorting. It's clear that stocks are going down in different patterns compared to how they go up. The theory of volatile periods in inverted leveraged ETFs is really not uique to them, it's how all stocks behave at bottoms.


Thursday, August 8, 2013

Multiple supporting floors

Another interesting observation. How there are alternative supporting floors, but they all have the same concave slope. And points of resistance always holds.


And final chart, our ongoing DUST volatolity:


Going long the correlating ETFs?

So I'm checking the paired bull ETFs (to the inverse ETFs from the last post) and how they develop after the point of touching resistance to the point of the highest top. The numbers are approximations sinse I get them from looking at a daily chart where I can't see the exact high and low for the day.

BZQ - UBR -> 89 - 154, (gain 73%), 9 months

Shorting the inverse ETF would have given 39% during same period. Funny how the chart makes sense from a technical perspective when I draw a line between the touch of the resistance point and the highest point.

BZQ - UBR -> 66.50 - 111.50, (gain 69%), 3.5 months

Shorting the inverse ETF would have given 46%


SKF - UYG -> 23.30 - 106, ( gain 355%) 4.5 years

Shorting the inverse ETF would have given 95%


YINN - YANG -> 16.50 - 26.10, ( gain 37%) 3.5 months (It would have actually been underwater for a short while.

Shorting the inverse ETF would have given 50%


The comparison between going long the bull ETF and shorting the inverse (bear) is not entirely fear. I'm measuring through to peak on the bull ETF and then the performance during the same time period for the inverse. I should probably also compare peak to throug from resistance point to the lowest point o the inverse ETF. But for now this will have to do. If a position is going to be taken on the bull ETF the touch of resistance point is a pretty good entry point and unlike the bottom point in the chart the resistance point is more spottable and still close in price to the bottom point.

Periods of volatility in leveraged ETFs

This will be the third post for today. During the short time I worked with this blog I've already come to some new realizations. After unsuccessfully trading stocks for many years I decided to think hard about what really works and what is more left to chance. I knew there was really only one patter I felt was realiable, the blow of top. I also knew it tended to manifest itself in shorter time periods on leveraged ETFs and in longer periods on single stocks. I have still to find out if that is only due to leverage, or if there are other differences too, which is most likely. It's clear to me that the shorter time patterns found on ETFs are more profitable sinse they take shorter time to play out. However, there are only so many leveraged ETFs and most of the time there is no pattern available at all. That is where the individual stocks come in, but since they have longer term BOTs timing is more difficult, the pattern takes longer to play out and a wrong entry will take longer time to be corrected. This is highly unfortunate because when an opportunity in a leveraged ETF appears money has to be available to play it. Due to this I will focus more attention on the leveraged ETFs and practice patience in an even larger amount.

I will also focus more on the theory of ETF volatility. The inversed (mostly) leveraged ETFs do not display long period of build ups and then blow of tops, they display periods of volatilaty consisting of a number of BOTs. After studying these patters tonight I noticed that they are not random but that they appear in pretty strong patterns. The BOTs appear in a megaphone pattern, in oscilations of increasing magnitude. In the end they get smaller with their height limeted by the supporting floor trendline for the megaphone pattern that after break of support becomes recistance.

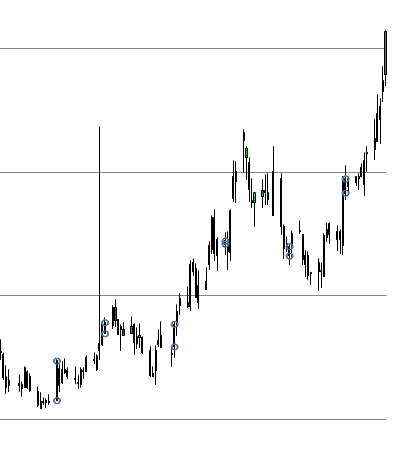
What better then to illustrate with some charts:

The tops gets larger in size until the floor trendline acts as resitance and the oscilations becomes smaller

 
The tops gets larger in size until the floor trendline acts as resitance and the oscilations becomes smaller, again. And it's the same ETF a few moths later.

This one could be seen to have several parts. The main larger part is a really clear megaphone pattern.  And once the floor is broken it holds as resistance in both the large and small pattern. (This is a bank ETF at the financial crises 2008)
It's hard to see where the trendline gets broken on this one but it's the same principle.
The oscillations doesn't really get larger on this one, the last peak is marginally higher then the first one though. But again resistance comes in on cue and the bottom floor trendline has the same slope as the other charts.
And again.

I didn't handpick these for the pattern. I just looked after periods of volatility and the charts all displayed the same pattern. The pool of data (volative periods in leveraged ETFs aren't really great but still it's a very interesting phenomenon. Even more interesting considering todays price action in DUST which I have been following closely on this blog.
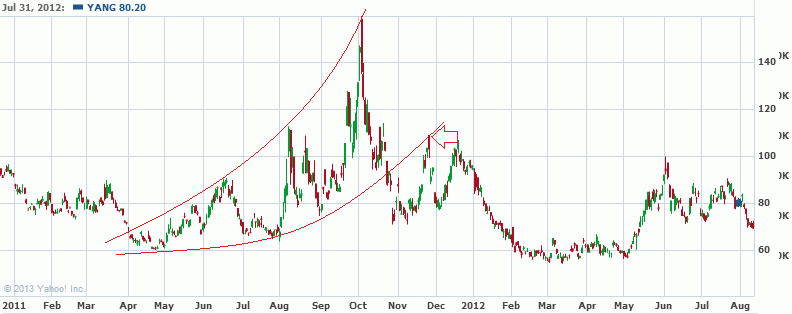
DUST, yestererday.
Today DUST fell 26%. It's safe to say I played this pattern much too concervatively, afraid of commiting too much money incase the build up would be big. Had I known about the sloped floor line acting as resistance in all exampels shown of valatile ETF periods I would have played it much more aggressivally. Maybe we will get another peak up against resistance soon, that would be a gift. Meanwhile this is a very strong pattern saying that DUST will loose a lot of value in the future. 

So to summarize my longest and most important post so far on this blog: Periods of volaltility in leveraged ETFs are a gift of predictabilaty. Something I'd like to do in the future is to see if I chart a normal stock with a three time magnified daily movement, like a three time leveraged ETF, will display similar patterns. Another thing I'd like to do is to check what happen to the other ETF in the leveraged ETF pair after resistance is touched.


Leveraged ETFs update

A quick update about the situation in leveraged ETFs. It's a bunch of inversed ETFs that looks interesting. Gold miners (DUST), emerging markets (EDZ), Brazil (BZQ), silver (DSLV) and natural gas (DGAZ). From this list I've already started to add short positions in DUST (the first one was at the 100 level) and will keep adding on further ascent. The rest is getting closer but not quite there yet.

Class is in session


Today I'm starting to write the series of lessons that I earlier promised on my theory of trading BOTs. It will all be really simple and short. I try to keep everything on this site that way. You'll find the lessons on the right side of the page under the section "My theory of BOTs". Lesson 1 is called "The BOT".

Wednesday, August 7, 2013

DXJ in the aftermath of a BOT


Today I'm going to post about a misstake. I am long DXJ, (a Nikkei equity ETF) for fundamental reasons. Well the charts is clearly in the aftermath of a BOT and I ignored it thinking that it will build higher to an even higher BOT, and maybe it will but it might take a long time. That is until yesterday when the realization came that I must sell this position. Well overnight the Nikkei fell 4% and I didn't sell yet. 

The lesson: never ignore the BOT pattern for fundamental reasons.