There are a couple different indicators to use for going long. The one I feel most comfortable with is a breakout pattern in combination with higher highs and higher lows. Let's look at the break out pattern first:

So the pattern is some kind of channeled choppiness and a breakout from the top channel. Now the channel doesn't have to be parallel, it could be triangular as well, it is usually upwards sloping but not always. There always has to be a breakout from the top channel.
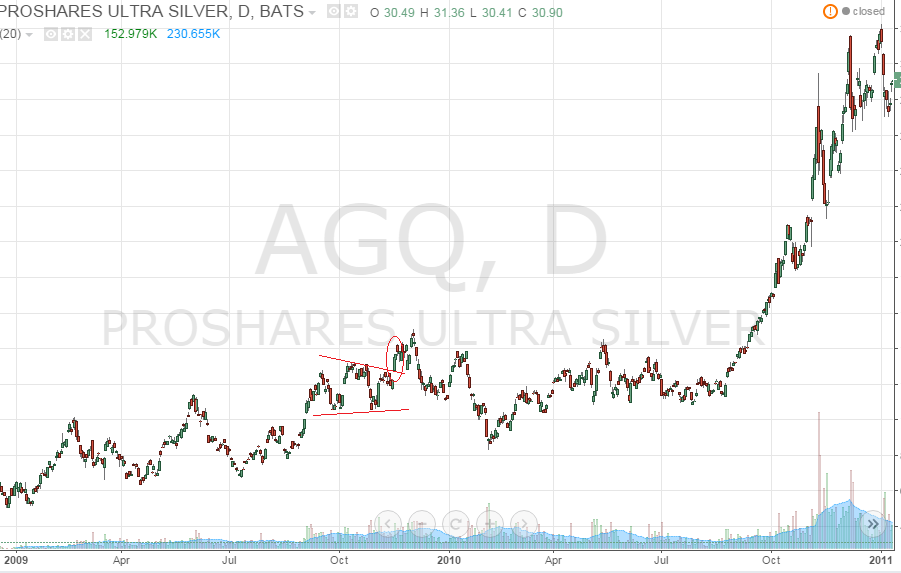
Let's look at some examples. Here are some upwards sloping trend channel breakouts:


But the breakout can also happen from downwards sloping trend channels and also really steep upwards sloping trend channels:


Here is the breakout pattern visible in a non inverse chart:

In order to get a fuller picture let's look at times when the pattern fails:
This is a clean fail. Could have still been profitable with a loose stop loss level.

This one was downsloping in a severe downtrend. Would have needed stop loss in order to avoid major loss.

Also downtrend, but would have been hard to avoid. A stop loss would have triggered

First one could have been profitable depending on the stop loss level. Second one also but only with a loose stop loss. It would have been easy to loose money on both.

A small profit would have been made right away but would have needed to take a partial at the first top for that. In total a stop loss would have triggered. Unprofitable.

Guaranteed stop loss trigger
.

Loose stop loss might have saved this one. Partial profit might have been taken in an early stage. (Unlikely)

Stop loss trigger. Breakout not clean.

Loose stop loss could save it. Breakout is red.

Stop loss trigger. Partial profit possible.

Stop loss trigger. Severe down trend.

This is an attempt to define a good stop loss level. This should not get stop lossed because the pullbacks are above the start of the pattern.

A clear stop loss trigger.
So in conclusion I haven't decided if this pattern is something I want to play yet. I'll probably analyse climbs in non inverse leveraged ETFs a bit further first.
